The On-Board Diagnostics II (OBD2) system has revolutionized vehicle maintenance and repair. It acts as the central nervous system of modern cars, constantly monitoring various parameters and providing invaluable real-time data. For car owners and technicians alike, Understanding Obd2 Live Data is crucial for diagnosing issues, optimizing performance, and ensuring the longevity of their vehicles. This in-depth guide will explore the intricacies of OBD2 live data, empowering you to effectively access and interpret this wealth of information.
A Look Back: The Evolution of OBD Systems
Before we delve into live data, it’s important to understand the journey of onboard diagnostics. The precursor, OBD1, was a rudimentary system primarily focused on basic emissions-related diagnostics. OBD2 emerged as a significant advancement, driven by stricter environmental regulations and the need for more comprehensive vehicle monitoring. This new standard brought standardized diagnostic trouble codes (DTCs) and, crucially, real-time data streaming capabilities. This leap forward made vehicle diagnostics more accessible, detailed, and ultimately, more effective.
Decoding OBD2 Live Data: The Real-Time Vehicle Snapshot
OBD2 live data offers a dynamic, second-by-second view into the operational heart of your vehicle. It’s a stream of real-time parameters broadcast from the vehicle’s Engine Control Unit (ECU) and other control modules. This data reflects the instantaneous values and status updates from various sensors and systems, providing a window into your car’s performance as it happens. By monitoring these parameters, you gain the ability to observe your vehicle’s behavior under different conditions, identify anomalies, and proactively address potential problems.
Essential Parameters within OBD2 Live Data
To effectively utilize OBD2 live data, familiarity with common parameters is key. Here are some of the most frequently encountered and insightful data points:
-
Engine RPM (Revolutions Per Minute): This parameter measures how fast the engine’s crankshaft is rotating. Abnormal RPM readings, whether too high or too low at idle or under load, can indicate a range of issues from vacuum leaks to sensor malfunctions.
-
Vehicle Speed: This straightforward parameter reports the vehicle’s current speed as measured by the speed sensors. It’s useful for verifying speedometer accuracy and diagnosing speed-related issues.
-
Throttle Position: Expressed as a percentage, this parameter indicates the opening angle of the throttle valve. It directly reflects driver input and is crucial for diagnosing acceleration problems or idle control issues.
-
Fuel System Status: This parameter provides insight into the operational mode of the fuel system. It can indicate whether the system is in open loop or closed loop, and if any fuel system related faults are present.
-
Short Term and Long Term Fuel Trim (STFT & LTFT): Fuel trims are percentage adjustments the ECU makes to the air-fuel mixture to maintain optimal combustion. Understanding fuel trim values is vital for diagnosing lean or rich fuel conditions, potentially caused by issues like vacuum leaks, faulty sensors, or fuel delivery problems.
-
Oxygen Sensor Data: Oxygen sensors measure the oxygen content in the exhaust gas. Their readings are critical for assessing the efficiency of the combustion process and the catalytic converter. Analyzing oxygen sensor data helps diagnose air-fuel mixture imbalances and catalytic converter performance.
-
Coolant Temperature: This parameter reports the engine coolant temperature. Monitoring coolant temperature is essential for preventing engine overheating and diagnosing cooling system malfunctions.
-
Intake Air Temperature (IAT): The IAT sensor measures the temperature of the air entering the intake manifold. Extreme intake air temperatures can affect engine performance and efficiency, making this parameter important for diagnosing related issues.
-
Manifold Absolute Pressure (MAP): MAP sensors measure the pressure within the intake manifold. Readings are directly related to engine load and are valuable for diagnosing vacuum leaks, sensor failures, and issues affecting engine breathing.
The Advantages of Monitoring OBD2 Live Data
Harnessing OBD2 live data offers numerous benefits for both vehicle owners and automotive professionals:
-
Real-Time Performance Insights: Live data provides immediate feedback on the effects of adjustments or repairs. You can instantly see how changes impact engine parameters, allowing for precise tuning and diagnostics.
-
Proactive Preventative Maintenance: By regularly monitoring live data, you can detect subtle anomalies and potential issues before they escalate into major problems. This proactive approach can save significant repair costs and downtime in the long run.
-
Optimized Vehicle Performance: Enthusiasts and technicians can utilize live data to fine-tune engine parameters, improving fuel efficiency, power delivery, and overall vehicle performance. This data-driven approach allows for targeted modifications for optimal results.
-
Emissions Compliance Verification: Live data monitoring can help ensure your vehicle operates within required emissions standards. By observing parameters like oxygen sensor readings and fuel trims, you can confirm your vehicle is running cleanly and efficiently, contributing to environmental responsibility and passing emissions tests.
Gaining Access: Tools for Reading OBD2 Live Data
Accessing OBD2 live data requires the right tools. Fortunately, a variety of options cater to different needs and budgets:
-
Handheld OBD2 Scanners: These portable devices plug directly into the OBD2 port and display live data on their screens. They are user-friendly, affordable, and ideal for basic diagnostics and quick checks.
-
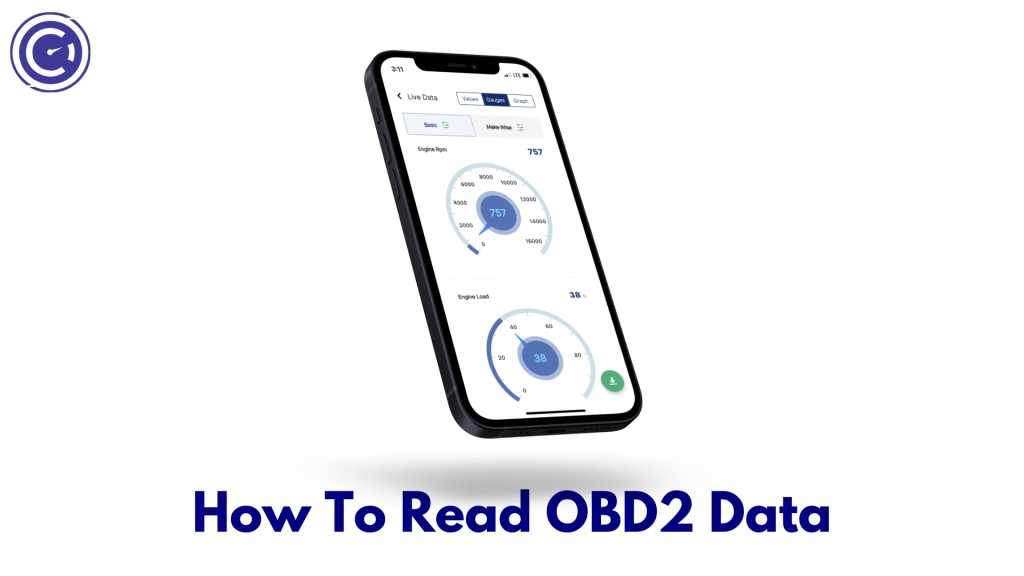
Smartphone Apps with OBD2 Bluetooth Adapters: This popular option combines the convenience of smartphones with the power of OBD2 diagnostics. Wireless Bluetooth adapters connect to the OBD2 port, transmitting data to user-friendly apps on your smartphone. These apps often offer customizable dashboards, graphing capabilities, and data logging features.
-
Professional-Grade Diagnostic Scan Tools: These advanced tools are used by professional mechanics and offer the most comprehensive capabilities. They provide in-depth live data analysis, bi-directional control, advanced testing features, and access to manufacturer-specific data, making them indispensable for complex diagnostics and repairs.
Essential Equipment for OBD2 Live Data Analysis
To begin reading OBD2 live data, you’ll need an OBD2 scanner or reader. For users seeking a robust and feature-rich option, tools like GaragePro offer advanced capabilities for both DIY enthusiasts and professionals.
Connecting Your OBD2 Reader: A Simple Process
Setting up an OBD2 reader is typically a plug-and-play process. The OBD2 port is usually located beneath the dashboard on the driver’s side.
 OBD2 Port Location Under Dashboard
To connect:
- Locate the OBD2 port in your vehicle.
- Plug the OBD2 reader securely into the port.
- Turn your vehicle’s ignition to the “ON” position (engine off).
- Power on your OBD2 scanner or launch your smartphone app.
- Establish a connection between the scanner/app and the vehicle.
If you encounter connection problems, ensure your tool is compatible with your vehicle’s make and model and double-check for any loose connections. Consult your scanner’s manual for specific troubleshooting steps.
Navigating the OBD2 Scanner Interface: Basic and Advanced Features
OBD2 scanner interfaces vary depending on the device, but most share common navigation principles.
Basic Interface Navigation
- Powering Up: Most scanners automatically power on when connected to the OBD2 port and the ignition is turned on.
- Main Menu: Upon startup, you’ll typically be presented with a main menu offering options like:
- Read Codes: Retrieves stored Diagnostic Trouble Codes (DTCs), providing a starting point for diagnosing problems.
- Erase Codes: Clears DTCs after repairs are completed. Use this function cautiously and only after addressing the underlying issue.
- Live Data: Accesses real-time data streams from the vehicle’s sensors and systems – the focus of this guide.
- Freeze Frame: Captures a snapshot of live data parameters at the moment a DTC is triggered, providing valuable context for diagnostics.
- Vehicle Information (VIN): Displays the vehicle’s identification number and other vehicle-specific information.
Exploring Advanced Features
More sophisticated scanners offer advanced functionalities that enhance diagnostic capabilities:
- Graphing and Data Logging: Visualizes live data parameters as graphs over time. This feature is invaluable for identifying trends, intermittent faults, and subtle performance fluctuations. Data logging allows you to record live data for later analysis.
- Advanced Tests: Professional-grade tools often include advanced tests like oxygen sensor tests, evap system tests, and bi-directional control functions.
- Manufacturer-Specific Data: Some scanners can access manufacturer-specific DTCs and parameters beyond the standardized OBD2 protocol, providing deeper diagnostic insights for specific vehicle brands.
Tips for Effective OBD2 Interface Navigation
- Consult the User Manual: Scanner interfaces differ. Always familiarize yourself with your scanner’s manual to understand its specific functions and navigation.
- Start with the Basics: Begin by mastering fundamental functions like reading and clearing codes before exploring advanced features.
- Record Data: Before clearing any DTCs, always record the codes and any associated freeze frame data. This information is crucial for accurate diagnosis and record-keeping.
- Prioritize Safety: Always ensure your vehicle is in a safe environment when performing diagnostics, especially when using live data features or conducting tests that require the engine to be running.
- Continuous Learning: Automotive technology and OBD2 systems are constantly evolving. Stay updated with new features, functionalities, and best practices to maximize your diagnostic skills.
Interpreting OBD2 Live Data: Understanding the Readouts
Interpreting live data is the most critical step in leveraging OBD2 for diagnostics. Here’s a guide to effectively analyze live data readouts:
Key Live Data Parameters for Interpretation
- Engine RPM: Compare readings to expected idle and operating RPM ranges for your vehicle. Deviations can indicate idle issues, misfires, or sensor problems.
- Vehicle Speed: Verify speedometer accuracy and speed sensor function. Discrepancies may point to sensor or ABS system issues.
- Throttle Position: Monitor throttle response and correlate it with engine RPM changes. Inconsistencies can indicate throttle body or sensor problems.
- Oxygen Sensor Data: Analyze sensor voltage fluctuations and patterns to assess air-fuel ratio balance and catalytic converter efficiency. Stagnant or unusual readings can indicate sensor faults or exhaust system leaks.
- Fuel System Status & Fuel Trims: Interpret fuel system status indicators and fuel trim percentages to diagnose rich or lean conditions, potentially caused by vacuum leaks, fuel delivery problems, or sensor malfunctions.
- Intake Air Temperature & Coolant Temperature: Monitor these temperatures to ensure they are within normal operating ranges. Overheating or consistently low readings can point to cooling system or sensor issues.
- Manifold Absolute Pressure (MAP): Analyze MAP readings in relation to engine load and throttle position. Abnormally high or low readings can indicate vacuum leaks, sensor failures, or intake restrictions.
Practical Tips for Data Interpretation
- Establish Baseline Norms: Familiarize yourself with typical live data ranges for your specific vehicle model under various operating conditions (idle, cruising, acceleration).
- Correlate Data with Symptoms: Match abnormal live data readings with observed vehicle symptoms. This targeted approach helps narrow down potential problem areas.
- Utilize Graphing Features: Employ graphing capabilities to visualize data trends and identify intermittent issues or gradual changes that might be missed in static data displays.
- Monitor Data Under Varying Conditions: Observe how live data parameters change during idle, acceleration, deceleration, and different driving conditions to gain a comprehensive understanding of system behavior.
- Cross-Reference with DTCs: Use Diagnostic Trouble Codes (DTCs) as starting points, and then utilize live data to further investigate and pinpoint the root cause of the issue. Live data provides the dynamic context often missing from static DTCs.
Applications of Live Data Interpretation
- Fuel Efficiency Diagnostics: Analyze oxygen sensor data, fuel trims, and MAP readings to identify factors impacting fuel economy, such as air-fuel mixture imbalances or vacuum leaks.
- Engine Performance Troubleshooting: Focus on throttle position, RPM, MAP, and ignition timing data to diagnose performance issues like sluggish acceleration, misfires, or rough idling.
- Emissions System Monitoring: Pay close attention to oxygen sensor data, catalytic converter monitor status, and EGR system parameters to ensure emissions system components are functioning correctly and the vehicle is environmentally compliant.
Deeper Dive: Common OBD2 Live Data Parameters Explained
To enhance your understanding of live data interpretation, let’s delve deeper into some key OBD2 parameters:
1. Engine RPM (Revolutions Per Minute)
- In Detail: Engine RPM is a fundamental parameter reflecting the engine’s rotational speed. It’s measured by the crankshaft position sensor and is a direct indicator of engine activity.
- Diagnostic Significance: High RPM at idle can indicate vacuum leaks or idle control system problems. Low RPM at idle or stalling can suggest issues with fuel delivery, ignition, or engine compression. Erratic RPM fluctuations can point to misfires or sensor problems.
2. Vehicle Speed
- In Detail: Vehicle speed is typically measured by wheel speed sensors and reported to the ECU. It’s a straightforward parameter but crucial for verifying speedometer accuracy and diagnosing speed-related issues.
- Diagnostic Significance: Inaccurate speed readings can indicate faulty wheel speed sensors, ABS system problems, or issues with the vehicle speed sensor itself.
3. Throttle Position
- In Detail: The throttle position sensor (TPS) measures the angle of the throttle valve, which controls air intake into the engine. It’s a primary input for the ECU to determine engine load and driver demand.
- Diagnostic Significance: Erratic throttle position readings, or a lack of change when the accelerator pedal is pressed, can indicate a faulty TPS sensor, throttle body issues, or problems with the electronic throttle control system.
4. Oxygen Sensor Data
- In Detail: Oxygen sensors (O2 sensors) measure the amount of oxygen in the exhaust gas before (upstream) and after (downstream) the catalytic converter. Upstream sensors are critical for air-fuel ratio control, while downstream sensors monitor catalytic converter efficiency.
- Diagnostic Significance: Slow or lazy oxygen sensor responses, voltage readings outside of normal ranges, or stuck readings can indicate sensor failure, air-fuel mixture problems, or catalytic converter inefficiency.
5. Fuel System Status
- In Detail: This parameter provides a general overview of the fuel system’s operational state. It often indicates whether the system is in open loop (ignoring O2 sensor feedback, typically during warm-up or heavy load) or closed loop (using O2 sensor feedback for precise air-fuel control).
- Diagnostic Significance: Fuel system status codes can provide clues about fuel pressure issues, injector problems, or general fuel delivery malfunctions.
6. Intake Air Temperature (IAT)
- In Detail: The IAT sensor measures the temperature of the air entering the engine’s intake manifold. Air density is temperature-dependent, so IAT readings are used by the ECU to adjust fueling and timing for optimal combustion.
- Diagnostic Significance: Consistently high IAT readings can indicate a hot air intake, potentially reducing engine power. Faulty IAT sensor readings can lead to incorrect fueling and performance problems.
7. Coolant Temperature
- In Detail: The coolant temperature sensor measures the temperature of the engine coolant. Maintaining proper coolant temperature is critical for preventing engine overheating and ensuring optimal engine operation.
- Diagnostic Significance: Overheating coolant temperatures are a serious concern and can indicate cooling system failures (thermostat, water pump, radiator). Consistently low coolant temperatures can suggest a stuck-open thermostat.
8. Manifold Absolute Pressure (MAP)
- In Detail: The MAP sensor measures the absolute pressure within the intake manifold. Pressure readings are directly related to engine load and vacuum.
- Diagnostic Significance: Low MAP readings at idle can indicate vacuum leaks. High MAP readings under load can suggest intake restrictions or sensor malfunctions. MAP sensor data is crucial for diagnosing engine breathing and load-related issues.
9. Short and Long-Term Fuel Trim (STFT & LTFT)
- In Detail: Fuel trims represent the percentage adjustments the ECU makes to the base fuel delivery rate to maintain the target air-fuel ratio (typically 14.7:1 stoichiometric for gasoline engines). Short-term fuel trim (STFT) is a quick, dynamic adjustment, while long-term fuel trim (LTFT) is a learned adjustment over time.
- Diagnostic Significance: Consistently positive fuel trim values (e.g., +10% or higher) indicate a lean condition (too much air, too little fuel), potentially caused by vacuum leaks or fuel delivery problems. Consistently negative fuel trim values (e.g., -10% or lower) indicate a rich condition (too much fuel, too little air), possibly due to fuel injector leaks or a faulty mass airflow (MAF) sensor.
10. Battery Voltage
- In Detail: This parameter measures the vehicle’s battery voltage. Proper battery voltage is essential for all vehicle electrical systems, including the ECU and sensors.
- Diagnostic Significance: Low battery voltage readings can indicate a weak battery, charging system problems (alternator), or parasitic draws. Voltage fluctuations can also cause sensor malfunctions and erratic data readings.
Unlocking Advanced Diagnostics: Features Beyond the Basics
Advanced OBD2 live data reading extends beyond basic parameters, offering deeper insights for complex diagnostics. These features are particularly valuable for experienced technicians and enthusiasts:
1. Real-Time Graphing
- Functionality: Visualizes live data parameters as dynamic graphs over time.
- Diagnostic Power: Graphing excels at revealing trends, intermittent glitches, and subtle performance variations that are difficult to spot in numerical data alone. It’s invaluable for diagnosing issues that occur only under specific conditions or are transient in nature.
2. Mode 6 Testing
- Functionality: Accesses enhanced diagnostic data beyond standard DTCs, often used by manufacturers for in-depth monitoring of non-continuously monitored systems.
- Diagnostic Power: Mode 6 data allows for proactive issue detection before a check engine light illuminates. It’s useful for preemptive maintenance, detailed component testing, and diagnosing issues that are not yet severe enough to trigger a standard DTC.
3. Fuel System Monitoring (Advanced)
- Functionality: Provides granular data on fuel system parameters, including fuel pressure (both commanded and actual), injector pulse width, and fuel pump duty cycle.
- Diagnostic Power: Essential for diagnosing intricate fuel delivery problems, evaluating injector performance, and optimizing fuel system operation for efficiency and power.
4. Advanced Emissions Readings
- Functionality: Offers detailed data on emissions-related systems, such as catalytic converter efficiency (using downstream O2 sensor data and catalyst temperature readings), EGR (Exhaust Gas Recirculation) system flow, and evaporative emissions (EVAP) system performance.
- Diagnostic Power: Crucial for ensuring emissions compliance, diagnosing complex emissions system faults, and pinpointing the root cause of emissions-related DTCs.
5. Boost Pressure (Turbocharged/Supercharged Engines)
- Functionality: Monitors manifold pressure in boosted engines, reporting boost pressure and vacuum levels.
- Diagnostic Power: Indispensable for diagnosing turbocharger or supercharger performance issues, boost leaks, and problems within forced induction systems.
6. Bi-Directional Control
- Functionality: Enables the scanner to send commands to the vehicle’s control modules, allowing for active testing of components and systems.
- Diagnostic Power: Allows technicians to activate components like fuel pumps, cooling fans, injectors, and solenoids directly from the scan tool for testing purposes. This feature is invaluable for isolating component failures and verifying system functionality.
7. Customizable Data Points (PIDs)
- Functionality: Allows users to select and monitor specific Parameter IDs (PIDs) relevant to the diagnostic task at hand.
- Diagnostic Power: Provides targeted diagnostics by focusing on only the most relevant data parameters, reducing data clutter and streamlining analysis.
8. Transmission Data
- Functionality: Accesses data from the transmission control module (TCM), providing insights into transmission temperature, gear selection, torque converter lock-up status, and shift solenoid operation.
- Diagnostic Power: Critical for diagnosing transmission problems, evaluating transmission health, and ensuring smooth and efficient transmission operation.
9. ABS and Airbag System Diagnostics
- Functionality: Reads data and DTCs from the Anti-lock Braking System (ABS) and Supplemental Restraint System (SRS/Airbag) modules.
- Diagnostic Power: Essential for diagnosing safety-critical systems and resolving ABS and airbag warning lights.
10. Parameter IDs (PIDs) – Deep Dive
- Functionality: Provides access to a vast library of PIDs, each representing a specific sensor reading, calculated value, or system status within the vehicle’s control modules.
- Diagnostic Power: Unlocks in-depth analysis of engine and vehicle operation, allowing experienced technicians to access highly specific data points and diagnose complex or obscure issues that standard DTCs might not reveal.
Troubleshooting Common OBD2 Live Data Issues
Encountering problems while reading OBD2 live data is not uncommon. Here are some troubleshooting tips:
- Verify Connection Integrity: Ensure the OBD2 scanner cable is securely plugged into both the scanner and the vehicle’s OBD2 port. A loose connection is a frequent culprit.
- Confirm Vehicle Compatibility: Double-check that your OBD2 scanner and app are compatible with your vehicle’s make, model, and year. Not all scanners support all vehicles or protocols.
- Test Scanner on Another Vehicle (If Possible): If you suspect a scanner malfunction, try using it on a known working vehicle to isolate whether the issue lies with the scanner itself or your vehicle.
- Check Vehicle Battery Voltage: Low vehicle battery voltage can sometimes interfere with data transmission to the OBD2 scanner. Ensure your vehicle’s battery is adequately charged and in good condition.
- Inspect ECU Communication and Power: Rule out potential ECU communication barriers. Check for blown fuses related to the ECU or OBD2 port. Inspect wiring for damage or corrosion.
- Sensor Accuracy and Calibration: If live data readings appear erratic or implausible, consider the possibility of faulty sensors. Inaccurate sensor readings can skew live data.
- Software and Firmware Updates: Ensure your OBD2 scanner’s software and your vehicle’s firmware are up to date. Updates often include bug fixes, improved compatibility, and enhanced features.
- Data Interpretation Knowledge: Proper interpretation relies on understanding normal data ranges and expected parameter behavior for your vehicle. Consult repair information and vehicle-specific resources.
- Data Filtering and Focus: When faced with a large volume of live data, filter and focus on parameters most relevant to the symptoms or DTCs you are investigating.
- Seek Professional Assistance: For complex diagnostic challenges or persistent OBD2 data issues, don’t hesitate to consult a qualified automotive technician.
OBD2 Live Data: A Cornerstone of Preventive Maintenance
OBD2 live data is not just for diagnosing problems; it’s a powerful tool for preventive maintenance. Regularly monitoring live data can shift your maintenance approach from reactive to proactive:
- Early Anomaly Detection: Live data allows you to identify subtle deviations from normal operating parameters before they trigger noticeable symptoms or major failures. This early detection enables timely intervention and prevents minor issues from escalating.
- Performance Optimization and Efficiency: By monitoring parameters like fuel trims, oxygen sensor data, and engine temperature, you can proactively maintain optimal engine performance and fuel efficiency. Addressing minor imbalances or inefficiencies early can save fuel and extend component life.
- Reduced Long-Term Repair Costs: Preventive maintenance based on live data insights helps avoid major, costly repairs down the road. Addressing small issues promptly prevents cascading failures and minimizes overall maintenance expenses.
- Enhanced Vehicle Safety and Reliability: Monitoring critical systems like brakes (ABS data), stability control (if available via OBD2), and engine health contributes to overall vehicle safety and reliability. Proactive maintenance ensures these systems are functioning optimally when needed.
- Emissions Compliance and Environmental Responsibility: Regularly checking emissions-related live data helps ensure your vehicle remains environmentally friendly and compliant with emissions regulations.
- Streamlined Diagnostics and Reduced Downtime: When issues do arise, having a history of baseline live data readings makes diagnostics faster and more efficient. You can quickly compare current data to historical norms to pinpoint deviations and troubleshoot more effectively, reducing vehicle downtime.
- Extended Vehicle Lifespan: A proactive, data-driven maintenance approach, guided by OBD2 live data, contributes to the long-term health, reliability, and ultimately, the extended lifespan of your vehicle.
Boosting Vehicle Performance with OBD2 Live Data
Beyond diagnostics and maintenance, OBD2 live data is a valuable asset for enhancing vehicle performance:
- Fine-Tune Fuel Efficiency: Analyze fuel trims and air-fuel ratios under various driving conditions to optimize fuel maps and improve fuel economy. Adjustments based on live data can lead to noticeable fuel savings.
- Optimize Engine Responsiveness: Utilize throttle position, RPM, and timing advance data to fine-tune engine parameters for improved throttle response and power delivery. Data-driven tuning allows for precise adjustments tailored to your vehicle’s characteristics.
- Monitor Engine Health Under Performance Conditions: Keep a close watch on coolant temperature, oil pressure (if available), and exhaust gas temperature (EGT – if available) during performance driving or towing to prevent overheating and engine stress.
- Identify and Rectify Performance Bottlenecks: Use live data to pinpoint performance limitations. For example, analyzing MAP readings and airflow data can reveal intake restrictions, while monitoring ignition timing can identify timing retard issues.
- Custom Engine Tuning and Modification Validation: For enthusiasts who modify their vehicles, live data is essential for validating the effectiveness and safety of modifications. It allows for precise tuning of aftermarket components and ensures optimal performance gains without compromising engine health.
- Enhance Transmission Efficiency: For vehicles with accessible transmission data, monitor transmission temperature and shift patterns to optimize shift points and torque converter lock-up for smoother shifting and improved acceleration.
- Emissions Reduction for Performance Vehicles: Even in performance applications, OBD2 data can be used to fine-tune engine parameters to minimize harmful emissions while maximizing power output.
- Predictive Performance Analysis: By logging and analyzing performance data over time, you can establish performance trends, predict potential issues, and proactively address them before they impact performance.
Conclusion: Embracing OBD2 Live Data for Superior Vehicle Management
Understanding OBD2 live data is no longer a niche skill but a fundamental competency for anyone involved in vehicle ownership or maintenance. It empowers you with real-time insights into your vehicle’s inner workings, transforming diagnostics, maintenance, and performance optimization. By embracing the power of OBD2 live data, you can ensure your vehicle operates at its peak, remains reliable for years to come, and provides a more informed and engaged ownership experience. Whether you are a seasoned technician or a car owner eager to learn more, mastering OBD2 live data is an investment in your vehicle’s health and your automotive knowledge.