Understanding your vehicle’s oxygen (O2) sensors is crucial for diagnosing engine performance issues and ensuring optimal fuel efficiency. With the advent of On-Board Diagnostics II (OBD2) systems, accessing live data from these sensors has become easier than ever. This guide will help you decipher Obd2 O2 Sensor Live Data, enabling you to pinpoint problems with greater accuracy.
Before diving into live data interpretation, it’s essential to correctly identify your O2 sensors. Automotive manufacturers commonly refer to O2 sensors using a bank and sensor number system. Let’s clarify what these designations mean:
- Bank 1: This refers to the engine bank that contains cylinder number 1. For inline engines, there’s only one bank (Bank 1). For V-type engines, Bank 1 is typically the bank on the passenger side in US vehicles, but always confirm based on cylinder numbering.
- Bank 2: In V-type engines, Bank 2 is the engine bank opposite to Bank 1. This is the side containing cylinder number 2.
- Sensor 1: This is the upstream O2 sensor. It’s located before the catalytic converter in the exhaust stream, closer to the engine. Its primary function is to measure the air-fuel ratio coming directly from the engine.
- Sensor 2: This is the downstream O2 sensor. It’s positioned after the catalytic converter. Sensor 2 monitors the efficiency of the catalytic converter and also provides feedback to the engine control unit (ECU) for fine-tuning fuel trims.
To summarize the common configurations:
- Bank 1 Sensor 1: Upstream sensor on the side of the engine with cylinder #1.
- Bank 1 Sensor 2: Downstream sensor on the side of the engine with cylinder #1, after the catalytic converter.
- Bank 2 Sensor 1: Upstream sensor on the side of the engine with cylinder #2 (V-engines only).
- Bank 2 Sensor 2: Downstream sensor on the side of the engine with cylinder #2, after the catalytic converter (V-engines only).
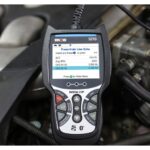
 OBD2 scanner displaying live data of O2 sensor voltage ranges
Now, let’s focus on interpreting “OBD2 O2 sensor live data.” When you connect an OBD2 scanner to your vehicle and access live data, you’ll typically see voltage readings for each O2 sensor. These voltage readings fluctuate and provide valuable insights into the air-fuel mixture and catalytic converter performance.
Understanding O2 Sensor Voltage Ranges in Live Data:
-
Upstream O2 Sensors (Sensor 1): These sensors are typically wideband or narrowband. Narrowband sensors, common in older vehicles, switch rapidly between low voltage (around 0.1V) indicating a lean mixture (excess oxygen) and high voltage (around 0.9V) indicating a rich mixture (excess fuel). A healthy upstream sensor should show rapid fluctuations between these ranges as the ECU constantly adjusts the air-fuel ratio to maintain stoichiometry (the ideal 14.7:1 air-fuel ratio for gasoline engines). Wideband sensors provide a more linear voltage output across a broader range of air-fuel ratios, offering more precise data.
-
Downstream O2 Sensors (Sensor 2): The downstream sensor’s voltage readings are usually more stable compared to the upstream sensor. After the exhaust gases pass through the catalytic converter, the oxygen content should be significantly reduced. A healthy downstream sensor typically shows a relatively steady voltage around 0.45V to 0.7V. If the downstream sensor voltage fluctuates similarly to the upstream sensor, or if it frequently reads low voltage, it could indicate a problem with the catalytic converter’s efficiency.
Diagnosing Issues Using OBD2 O2 Sensor Live Data:
-
Slow Response or No Switching: If an upstream O2 sensor’s voltage is slow to respond to changes in engine conditions (e.g., acceleration or deceleration), or if it’s “lazy” and not switching between lean and rich, it may be failing. This can lead to poor fuel economy, increased emissions, and driveability issues.
-
Stuck Lean or Rich Readings: A consistently low voltage reading (stuck lean) from the upstream sensor might indicate a lean condition, possibly due to vacuum leaks or fuel delivery problems. Conversely, a consistently high voltage reading (stuck rich) could suggest a rich condition, potentially caused by faulty fuel injectors or a malfunctioning mass airflow (MAF) sensor.
-
Downstream Sensor Mimicking Upstream Sensor: As mentioned earlier, if the downstream sensor’s live data shows fluctuations similar to the upstream sensor, it suggests the catalytic converter is not efficiently reducing pollutants. This could indicate a failing catalytic converter or, in some cases, exhaust leaks before the downstream sensor.
Important Considerations:
-
Warm-up Period: O2 sensors require heat to function correctly. When you first start your vehicle, the live data readings might be inaccurate until the sensors reach their operating temperature.
-
Check for Codes: Always check for OBD2 trouble codes related to O2 sensors. Codes like P0130-P0167, P0420, and P0430 are commonly associated with O2 sensor or catalytic converter issues. Live data analysis complements code reading and helps to confirm the diagnosis.
-
Other Sensor Data: Interpreting O2 sensor live data is most effective when considered in conjunction with other sensor data, such as MAF sensor readings, engine coolant temperature, and fuel trims. This holistic approach provides a more comprehensive picture of the engine’s overall health.
While a fault code pointing to an O2 sensor might seem straightforward, always use live data to validate the issue and to rule out other potential underlying problems. Remember, O2 sensor failures can sometimes be a symptom of other engine malfunctions rather than the root cause. By carefully analyzing OBD2 O2 sensor live data, you can enhance your diagnostic skills and ensure accurate and effective vehicle repairs. For detailed specifications and expected voltage ranges for your specific vehicle, always refer to the manufacturer’s service manual.