OBD2 scanners have revolutionized vehicle diagnostics, becoming indispensable tools for car owners and professional mechanics alike. They provide a window into your vehicle’s inner workings, offering real-time insights into various systems and sensors. Among the most valuable capabilities is accessing live data. But how to read live data on an OBD2 scanner effectively, and what information can it unlock about your car’s health?
This comprehensive guide will delve into the world of OBD2 live data, explaining what it is, the key types of data you’ll encounter, and most importantly, how to interpret this information to diagnose and maintain your vehicle proactively. We’ll empower you to move beyond basic error codes and truly understand your car’s performance in real-time.
Understanding Live Data on Your OBD2 Scanner
Live data, also known as parameter identification data (PIDs), is essentially a stream of real-time information transmitted by your vehicle’s onboard computer system while the engine is running. Think of it as a live feed of vital signs for your car, constantly updating and reflecting the current operating conditions.
An OBD2 scanner reads this data directly from your vehicle’s diagnostic port, displaying a wide array of metrics. This can range from fundamental readings like engine RPM and vehicle speed to more intricate data from sensors monitoring the engine, transmission, emissions system, and more.
The power of live data lies in its ability to show you exactly what’s happening within your car at any given moment. This real-time perspective is invaluable for:
- Pinpointing the root cause of issues: Live data can reveal sensor malfunctions, mechanical problems, and even intermittent faults that may not trigger a static error code.
- Proactive maintenance: By observing data trends, you can identify potential problems before they escalate into major repairs.
- Performance monitoring: Enthusiasts and performance tuners use live data to optimize engine performance and track modifications.
- Verifying repairs: After completing a repair, live data can confirm if the issue is resolved and that systems are functioning correctly.
Keep in mind that the specific data parameters available will depend on your vehicle’s make, model, and year, as well as the capabilities of your OBD2 scanner. More advanced scanners typically offer a broader range of data points.
Key Types of Live Data Parameters and Their Meanings
When you access live data on your OBD2 scanner, you’ll be presented with a list of parameters. Understanding what each parameter represents is crucial for effective diagnosis. Here are some of the most common and important types of live data you’ll likely encounter, and what they indicate about your vehicle’s condition:
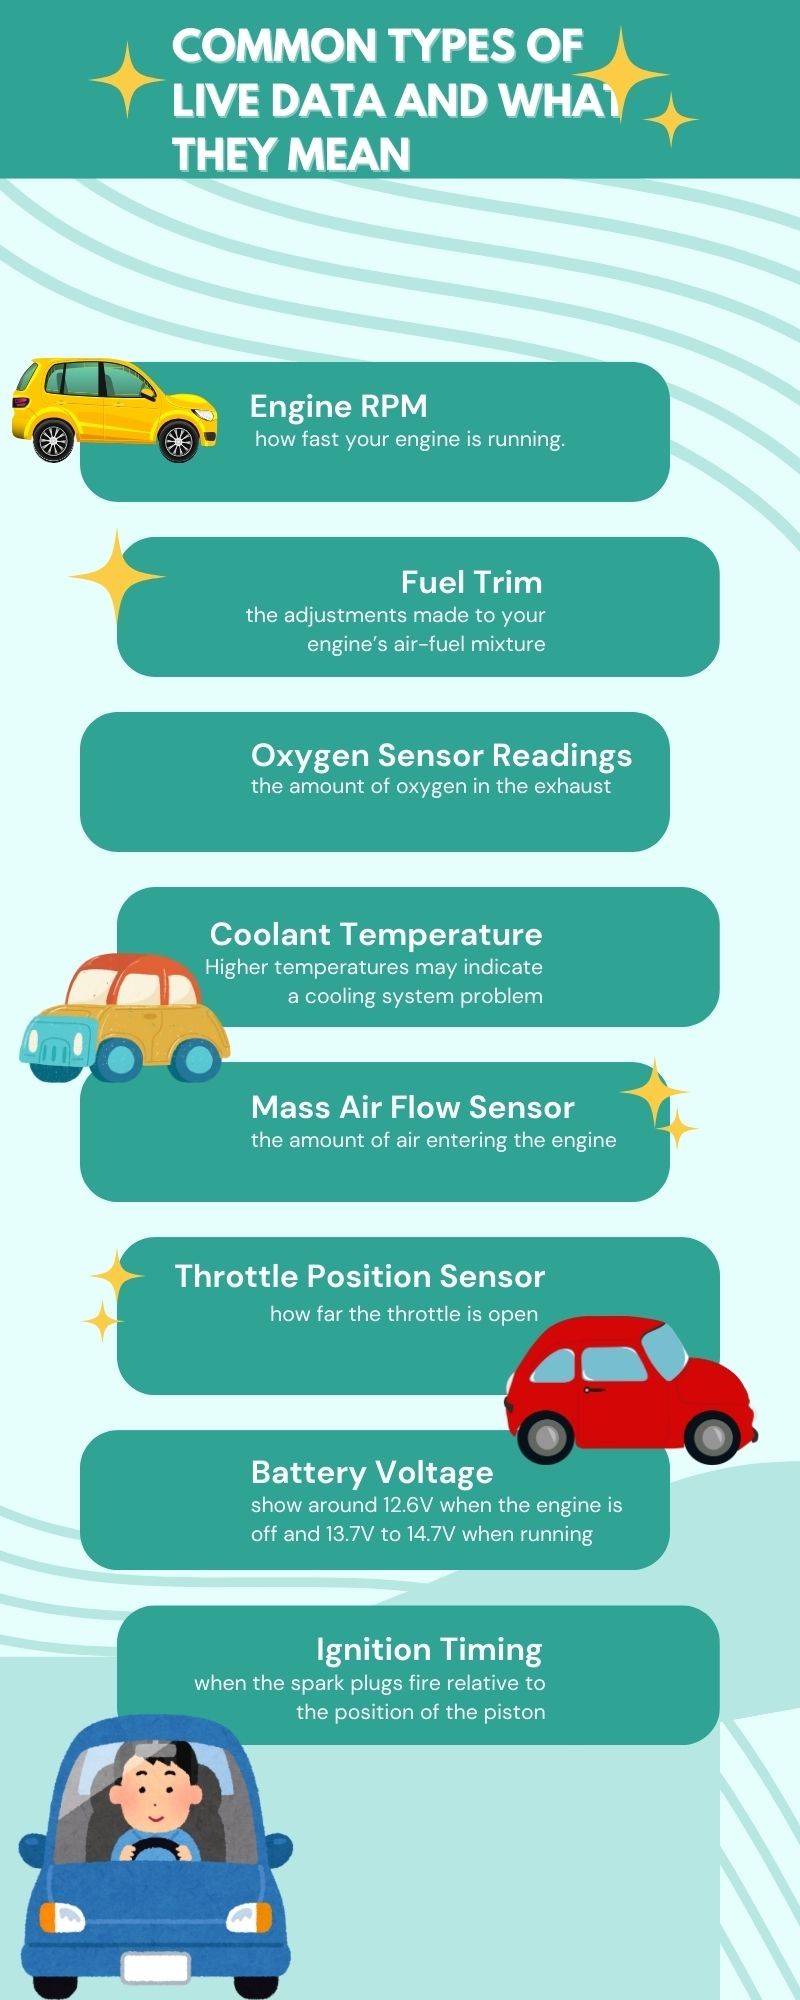
1. Engine RPM (Revolutions Per Minute):
- What it is: Measures how fast the engine’s crankshaft is rotating, indicating engine speed.
- What it tells you: Essential for understanding engine load and idle stability. Unusually high idle RPM can suggest issues like vacuum leaks or problems with the idle air control system. RPM fluctuations can point to misfires or fuel delivery problems.
2. Fuel Trim (Short Term Fuel Trim – STFT & Long Term Fuel Trim – LTFT):
- What it is: Indicates the percentage adjustment the engine control unit (ECU) is making to the air-fuel mixture to achieve the optimal ratio (stoichiometric).
- What it tells you: Positive fuel trim values mean the ECU is adding fuel (lean condition – too much air), often due to vacuum leaks, low fuel pressure, or faulty sensors. Negative values indicate the ECU is removing fuel (rich condition – too much fuel), potentially from fuel injector leaks, high fuel pressure, or air intake restrictions. Consistently high or low values on either STFT or LTFT are key indicators of fuel system problems.
3. Oxygen Sensor Readings (O2 Sensors):
- What it is: Voltage readings from oxygen sensors located in the exhaust system, measuring the amount of oxygen in the exhaust gases before and after the catalytic converter.
- What it tells you: Front O2 sensors (upstream) are crucial for air-fuel mixture control. Erratic or slow readings can indicate sensor failure or air-fuel mixture issues. Rear O2 sensors (downstream) primarily monitor catalytic converter efficiency. Faulty readings can signal catalytic converter problems or exhaust leaks.
4. Coolant Temperature:
- What it is: The temperature of the engine coolant, reflecting the engine’s operating temperature.
- What it tells you: Normal operating temperature typically ranges between 190°F and 220°F (88°C to 104°C). Overheating (higher temperatures) can indicate serious cooling system problems like thermostat failure, radiator issues, water pump malfunctions, or coolant leaks. Low temperatures might point to a faulty thermostat or temperature sensor.
5. Mass Air Flow (MAF) Sensor Reading:
- What it is: Measures the mass of air entering the engine’s intake system.
- What it tells you: Essential for calculating the correct air-fuel mixture. Low or inaccurate MAF readings can result from a dirty or failing sensor, intake leaks after the MAF sensor, or wiring issues. This can lead to poor engine performance, reduced fuel economy, and emissions problems.
6. Throttle Position Sensor (TPS) Reading:
- What it is: Indicates the angle of the throttle plate, reflecting how open the throttle is and how much air is entering the engine.
- What it tells you: The TPS is crucial for engine control and acceleration. Erratic or inconsistent readings can cause hesitation, poor acceleration, stalling, or idle issues. Problems can stem from a faulty sensor, wiring issues, or throttle body problems.
7. Battery Voltage:
- What it is: The voltage of the vehicle’s battery, indicating its charge level and the health of the charging system.
- What it tells you: A healthy battery should read around 12.6V when the engine is off and between 13.7V and 14.7V when the engine is running (charging by the alternator). Low voltage (below 12V when off, or below charging range when running) can indicate a failing battery, alternator issues, or parasitic drain. High voltage (above charging range when running) might suggest a faulty voltage regulator.
8. Ignition Timing:
- What it is: Indicates when the spark plugs fire in relation to the piston’s position in the cylinder.
- What it tells you: Correct ignition timing is vital for efficient combustion and engine performance. Incorrect timing (too advanced or too retarded) can lead to knocking (pinging), reduced power, poor fuel economy, and increased emissions. Issues can arise from a faulty crankshaft or camshaft position sensor, timing chain problems, or ECU malfunctions.
This is just a selection of common live data parameters. Your OBD2 scanner may display many more, depending on its capabilities and your vehicle. Consulting your vehicle’s repair manual or online resources specific to your make and model can provide more detailed information on the parameters available and their expected ranges.
Effective Strategies for Reading and Interpreting Live Data
Successfully interpreting live data requires a systematic approach and understanding of your vehicle’s normal operating parameters. Here’s how to effectively read and interpret the data from your OBD2 scanner:
-
Establish Baseline Values: Before diving into diagnostics, familiarize yourself with the typical live data readings for your vehicle when it’s running correctly. Your car’s repair manual, online forums, or reputable automotive databases can provide these baseline values. Knowing what “normal” looks like is crucial for identifying deviations.
-
Focus on Patterns and Trends: Don’t get fixated on single, isolated readings. Live data is most insightful when you observe patterns and trends over time. For example, a coolant temperature that gradually climbs too high while driving uphill is more significant than a momentary spike. Similarly, consistently elevated fuel trim values indicate a persistent issue, not just a fleeting anomaly.
-
Utilize Freeze Frame Data: Whenever your OBD2 scanner flags a trouble code, it often provides “freeze frame” data. This feature captures a snapshot of sensor readings at the precise moment the code was triggered. Freeze frame data is invaluable for diagnosing intermittent problems because it provides context to the conditions when the fault occurred. Analyze the freeze frame data alongside the live data to understand the sequence of events leading to the issue.
-
Correlate Data with Symptoms: Effective diagnosis involves connecting live data readings with the symptoms your vehicle is exhibiting. For example, if you’re experiencing rough idling and notice high positive fuel trim values, you can suspect a vacuum leak as the likely cause. Similarly, if you’re noticing poor fuel economy and see abnormal MAF sensor readings, investigate potential air intake problems.
-
Test Under Different Conditions: Live data can be dynamic, changing based on driving conditions. Test your vehicle under various scenarios – idling, acceleration, cruising, and deceleration – to see how the data parameters respond. This can help uncover issues that only manifest under specific operating conditions. For instance, a cooling fan issue might only become apparent when the vehicle is idling in traffic, causing coolant temperature to rise.
-
Compare Data Across Sensors: Look for discrepancies or inconsistencies between related sensors. For instance, if one oxygen sensor reading is drastically different from the others, it could indicate a problem with that specific sensor or the components it monitors.
-
Consult Repair Information: When interpreting complex data or encountering unfamiliar parameters, don’t hesitate to consult repair information specific to your vehicle. Repair manuals, online databases, and professional diagnostic resources can provide detailed explanations of data parameters, expected ranges, and diagnostic procedures.
Diagnosing Common Vehicle Problems Using Live Data
Live data is not just about reading numbers; it’s about using those numbers to solve real-world vehicle problems. Here are some examples of how live data can be instrumental in diagnosing common automotive issues:
-
Check Engine Light Diagnostics: When the check engine light illuminates, an OBD2 scanner will provide diagnostic trouble codes (DTCs). However, live data takes diagnostics a step further. For example, a DTC indicating an oxygen sensor issue can be verified by examining live O2 sensor readings. Live data can confirm if the sensor is truly malfunctioning or if the code is triggered by a related issue like an air-fuel mixture imbalance, which is reflected in fuel trim data.
-
Intermittent Performance Issues: Diagnosing intermittent problems like misfires, hesitations, or stalling can be challenging with just error codes. Live data allows you to monitor key parameters in real-time while driving, capturing data when the issue occurs. By observing fuel trim, ignition timing, MAF sensor readings, and other relevant parameters during these events, you can pinpoint the conditions triggering the problem and identify the faulty component or system.
-
Fuel Efficiency Problems: A sudden drop in fuel economy can be frustrating. Live data helps you investigate potential causes. Monitor parameters like MAF sensor readings, throttle position, and oxygen sensor data. Abnormal MAF readings might indicate a dirty sensor restricting airflow, while incorrect throttle position readings could reveal throttle body issues. Oxygen sensor data can highlight rich or lean conditions affecting fuel consumption.
-
Overheating Issues: Overheating is a serious problem that can cause significant engine damage. Live data is crucial for diagnosing cooling system malfunctions. Monitor coolant temperature, and if you observe unexpected spikes, examine related data like cooling fan status (if available as a parameter) and thermostat operation (indirectly inferred from temperature trends). Live transmission temperature data (if supported by your vehicle and scanner) can also help diagnose transmission overheating issues.
By leveraging live data, you can move beyond guesswork and adopt a more targeted, efficient approach to vehicle diagnostics and repair.
Conclusion: Mastering Live Data for Vehicle Health
Learning how to read live data on an OBD2 scanner empowers you to take control of your vehicle’s maintenance and diagnostics. It transforms your OBD2 scanner from a simple code reader into a powerful diagnostic tool, providing a wealth of information about your car’s real-time operation.
By understanding the key data parameters, learning to interpret trends and patterns, and applying this knowledge to diagnose common issues, you can proactively maintain your vehicle, identify problems early, and potentially save significant time and money on repairs. Whether you’re a seasoned DIY mechanic or a car owner looking to be more informed about your vehicle, mastering live data analysis is an invaluable skill for modern vehicle ownership.
FAQs About Reading Live Data on OBD2 Scanners
Why is freeze frame data important in diagnostics?
Freeze frame data captures a snapshot of critical sensor readings at the precise moment a diagnostic trouble code (DTC) is triggered. This historical data is crucial for understanding the conditions that led to the fault, especially for intermittent issues. It provides valuable context, helping to pinpoint the root cause of the problem by showing what was happening with various systems when the code was set.
Which OBD-II operating mode displays real-time data?
OBD-II operating mode 1 is specifically designed to display current, real-time data from vehicle sensors. This mode allows users to monitor live data streams, observing how parameters change as the vehicle operates. It’s the primary mode for accessing and interpreting live data for diagnostic purposes.
What types of diagnostic trouble codes trigger freeze frame data storage?
Freeze frame data is typically stored when emission-related diagnostic trouble codes (DTCs) are activated. These are commonly P-codes (powertrain codes) that pertain to engine and transmission systems, as well as other codes related to emissions control systems. The focus on emissions-related codes ensures that freeze frame data is available for issues that can impact air quality and regulatory compliance.