Just getting my hands on my first OBD2 scan tool, the Bluetooth-enabled BlueDriver, has been an exciting experience, especially diving into the real-time data it offers. After hearing positive reviews about the BlueDriver OBD2 scanner online, particularly its enhanced support for Honda vehicles, I decided to purchase one from Amazon. Being a new Honda owner, I’m keeping my fingers crossed that I won’t need to use its fault code reading capabilities anytime soon. However, exploring the live data features has already proven to be quite fascinating.
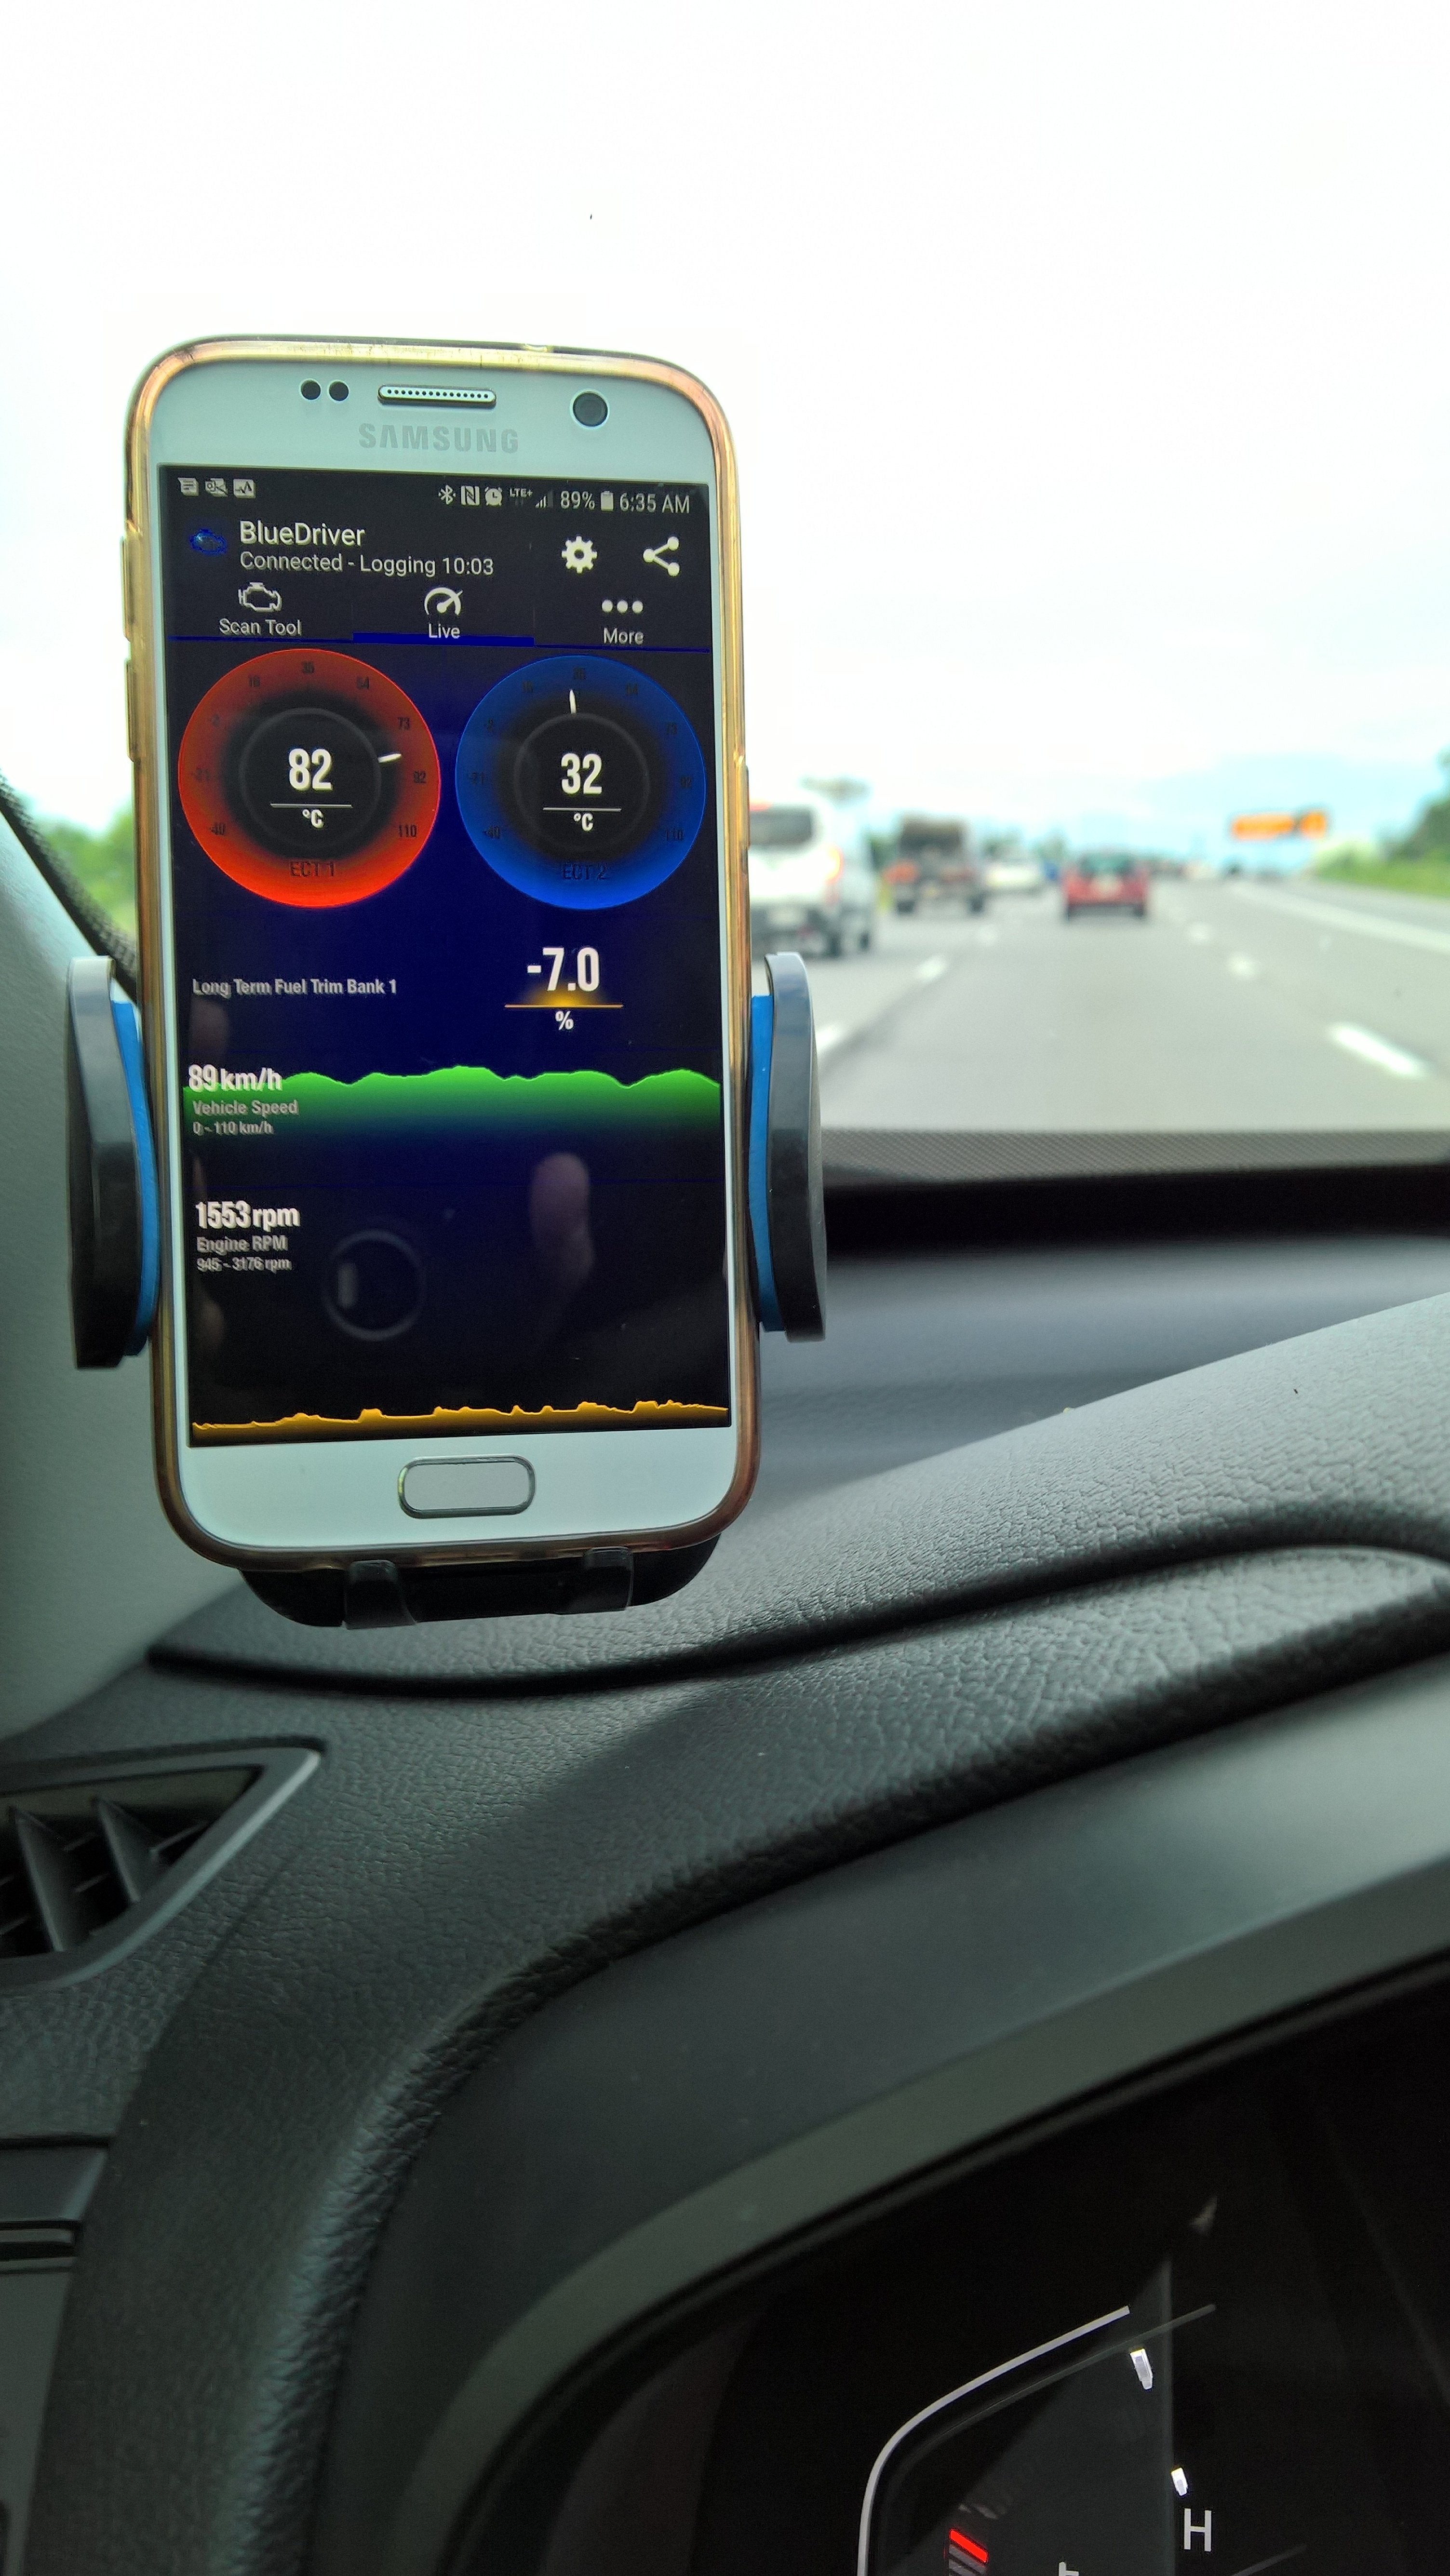
One of the first things I observed while using the BlueDriver was the engine’s operating temperature. Assuming the Engine Coolant Temperature 1 (ECT1) reading closely reflects the actual engine temperature, my Honda seems to operate consistently between 80°C to 85°C (176°F to 185°F). This temperature range appears slightly lower than what I’ve seen in other vehicles. Interestingly, once the engine reaches its operating temperature, it remains remarkably stable, regardless of driving conditions – whether I’m in stop-and-go traffic or idling for an extended 20-minute period. The temperature gauge on the dashboard only starts to move when the coolant temperature hits around 55°C (132°F) and reaches the top mark at approximately 75°C (165°F). It seems the thermostat is precisely calibrated to open when the engine reaches its optimal operating temperature, as indicated by the Radiator Coolant Temperature (ECT2) starting to rise only after ECT1 stabilizes.
Another interesting aspect I’ve been monitoring with the BlueDriver OBD2 scanner is fuel trims. So far, my short-term fuel trim (STFT) has been averaging around -5.5%, and the long-term fuel trim (LTFT) about -8%, consistently negative. I’ve been using E0 fuel and recently switched to E10 to see if it will have a “positive” impact on these readings, as some discussions online have suggested.
The BlueDriver app makes it easy to visualize this data. Below, you can see a screenshot of the live data display while driving. The app also allows for creating graphs from the collected data, which is incredibly useful for spotting trends and analyzing specific parameters over time.
For a closer look at fuel trims, here’s a graph focusing specifically on the STFT and LTFT values, providing a zoomed-in view of their fluctuations.
I’m curious to observe how these readings will change as winter approaches. Living in a region with very cold winters and having a daily commute that Honda might consider “short distance,” it will be interesting to see the impact on engine temperatures and fuel trims in colder conditions. The BlueDriver OBD2 scanner is proving to be a valuable tool for understanding my vehicle’s performance and I look forward to exploring more of its capabilities.