Just got my hands on the BlueDriver Bluetooth OBD2 Scanner here in the UK and I’m already impressed with the real-time data it offers. After reading numerous positive reviews online, particularly highlighting its enhanced diagnostic capabilities for brands like Honda, I decided to purchase this Bluetooth OBD2 scanner from Amazon UK. Being a new Honda owner myself, the enhanced support was a key selling point, although thankfully, I haven’t needed to use it for fault codes yet and hope not to for a long time! However, diving into the live data has been fascinating right from the start.
One of the first things I wanted to check was engine temperature. Assuming the Engine Coolant Temperature 1 (ECT1) reading accurately reflects the actual engine temperature, my Honda seems to operate consistently between 80°C and 85°C (176°F to 185°F). This appears to be a slightly cooler operating temperature than many engines I’ve encountered. What’s impressive is how stable it remains. Whether I’m stuck in stop-and-go traffic typical of UK city driving, or idling for a good 20 minutes, the temperature holds steady. Interestingly, the dashboard gauge only starts to move around 55°C (132°F) and reaches its normal position around 75°C (165°F). It seems the thermostat is doing its job, only opening once the engine reaches its optimal operating temperature, as indicated by the Radiator Coolant Temperature (ECT2) starting to rise afterwards.
My initial observations on fuel trims are also noteworthy. So far, I haven’t seen any positive fuel trim values. The Short Term Fuel Trim (STFT) has been averaging around -5.5%, and the Long Term Fuel Trim (LTFT) about -8%. I’ve been using standard UK unleaded fuel (E0 equivalent) and recently switched to E10 fuel, as is becoming increasingly common in the UK, to see if this has any impact and potentially brings the fuel trims closer to zero, as some discussions online suggest.
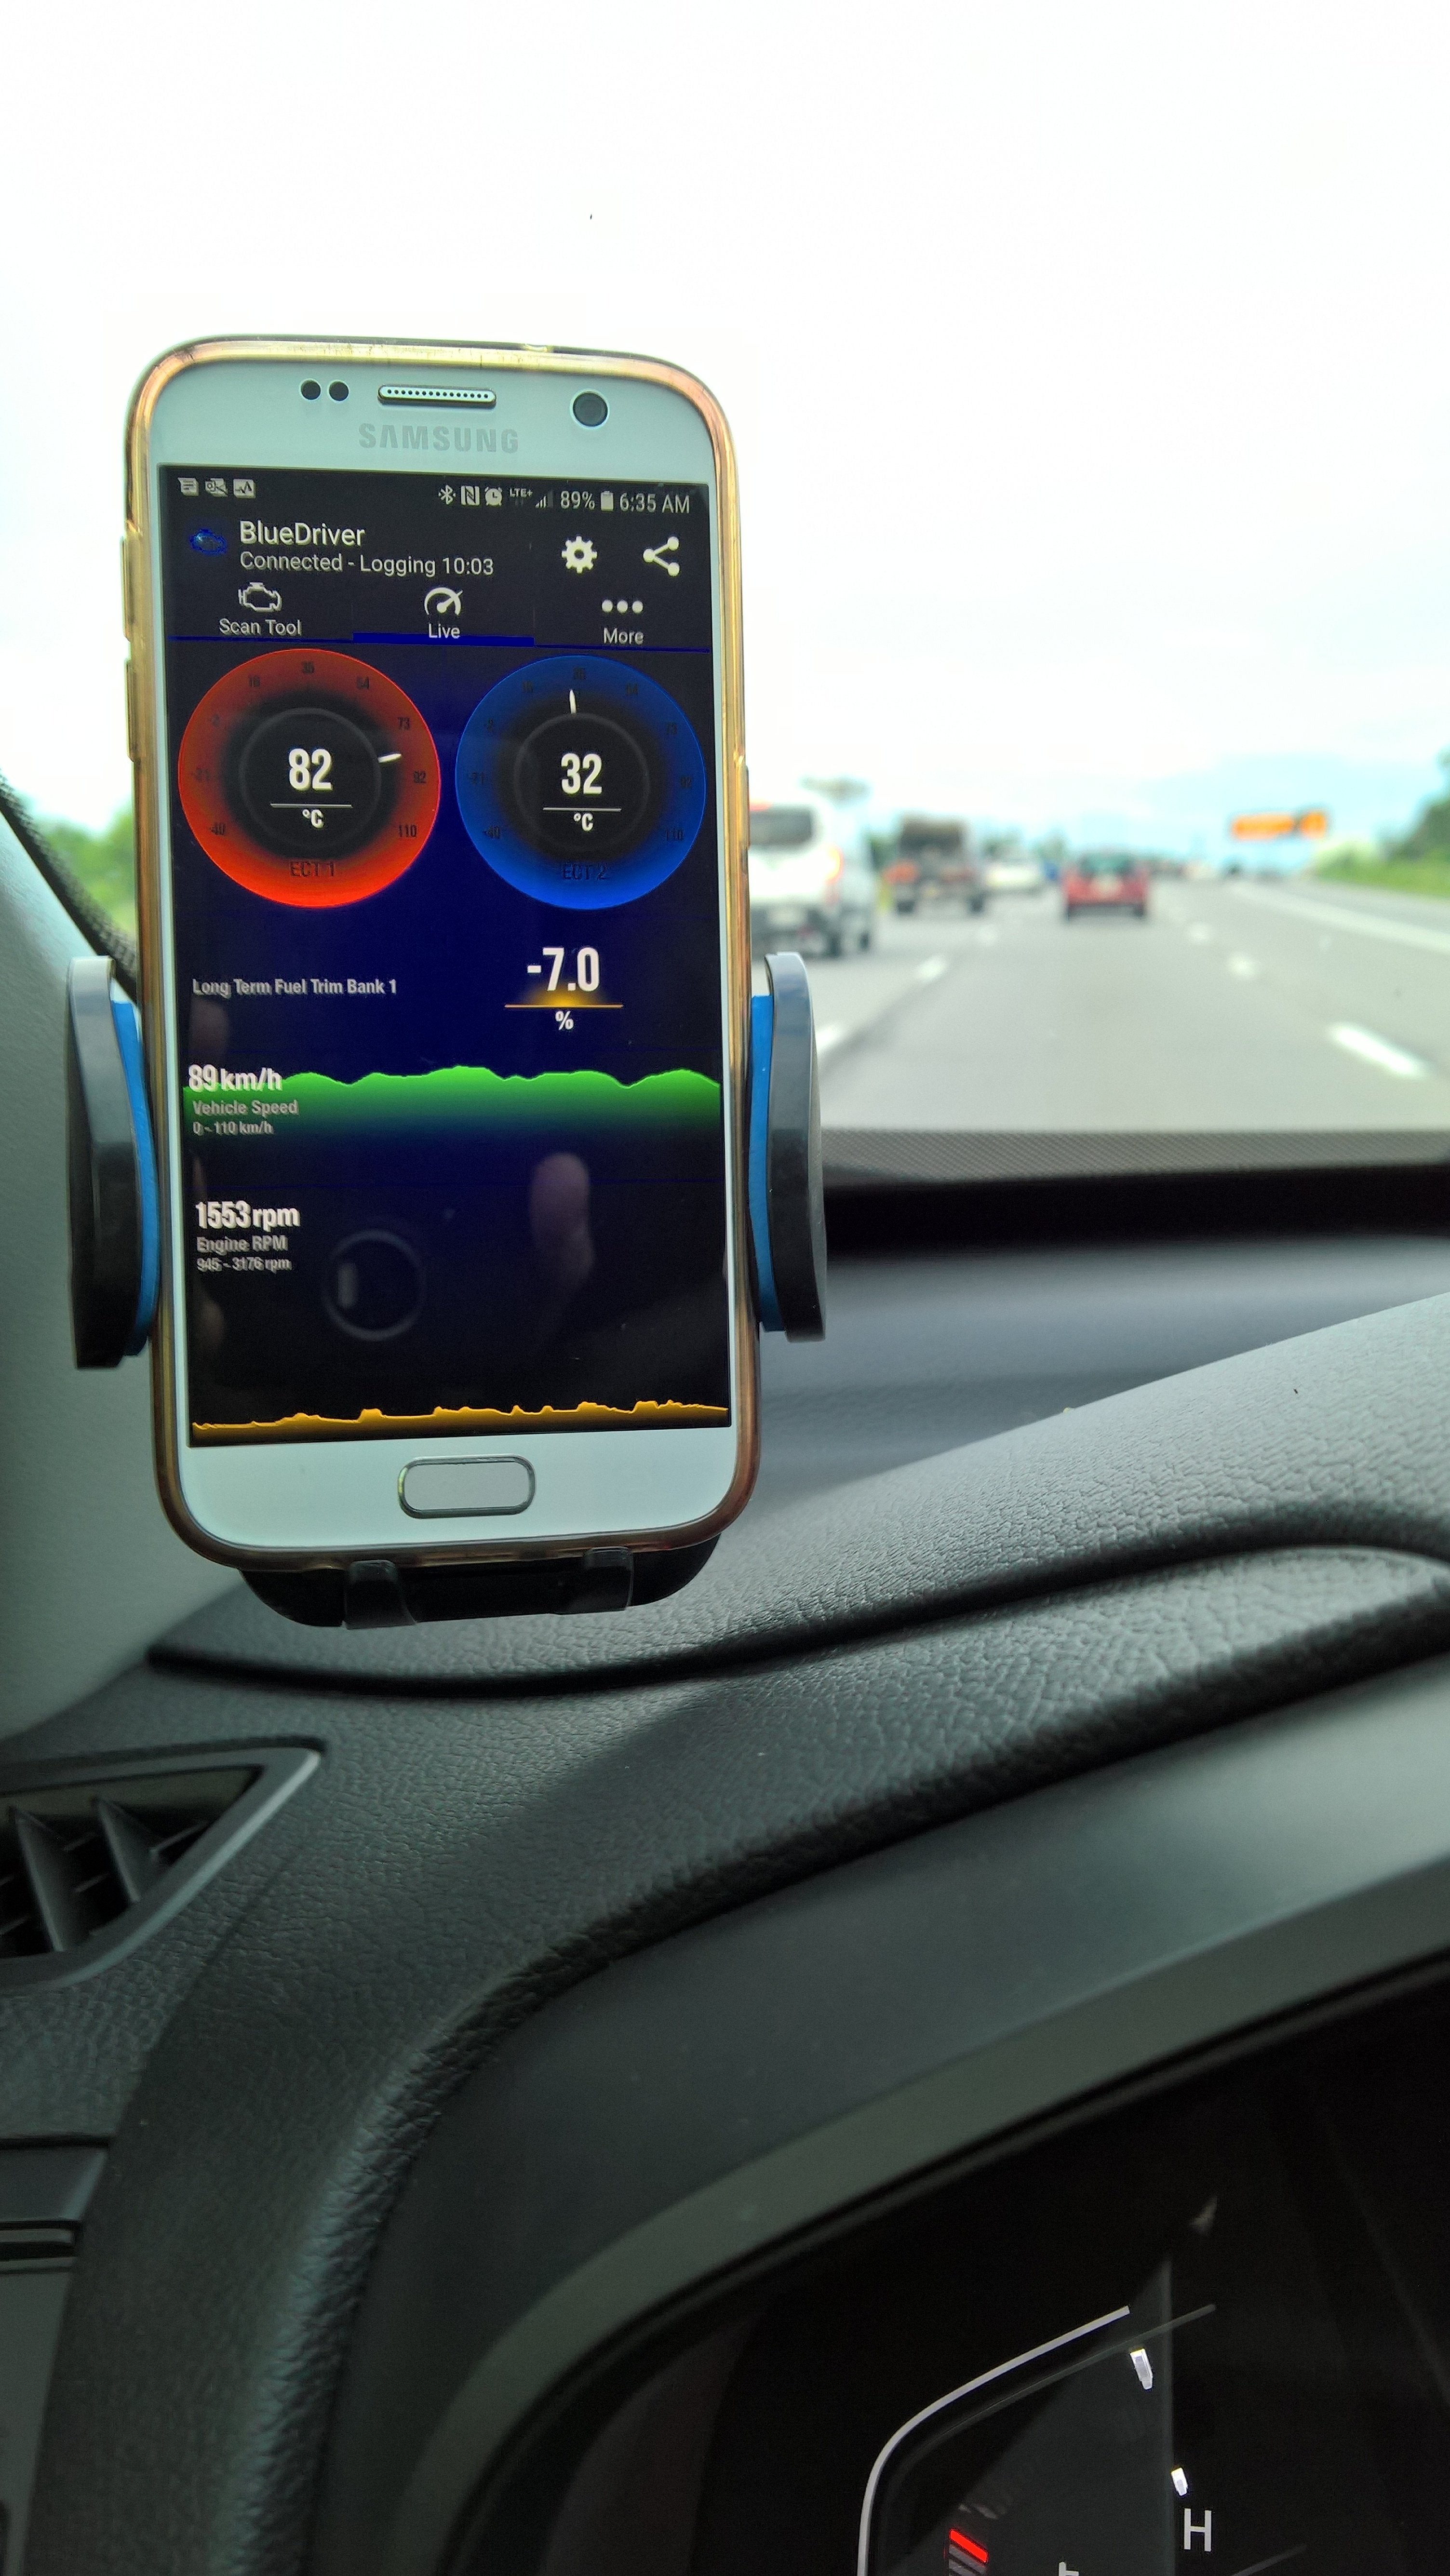
The BlueDriver app makes visualizing this data incredibly easy. The live display is clear and customizable, and generating graphs from the recorded data is straightforward. I’ve included a screenshot of the live data display while driving and a graph focusing on the STFT and LTFT to give you an idea of what you can see.
Looking ahead, I’m keen to monitor how these readings change as we move into the colder months here in the UK. Living in a region that experiences fairly cold winters and having a commute that Honda might consider “short distance,” it will be interesting to see how the BlueDriver Bluetooth OBD2 scanner helps in understanding and potentially optimizing my car’s performance in varying UK driving conditions. This BlueDriver scanner is proving to be a valuable tool for any car owner in the UK interested in understanding their vehicle’s health and performance data.