Just got my hands on a BlueDriver OBD2 scanner here in the UK, and I’m already impressed with the live data it offers. After reading some great online reviews, I opted for this Bluetooth model from BlueDriver (bluedriver.com) specifically because it boasts enhanced diagnostic capabilities for Honda vehicles. Purchased it easily online – a great tool for any car enthusiast in the UK. Being a new Honda owner, I’m hoping to keep fault codes at bay for as long as possible! But in the meantime, exploring the live data is proving to be quite fascinating.
One of the first things I noticed using the BlueDriver scanner is the engine’s operating temperature. If the ECT1 reading accurately reflects the engine temperature, it seems my Honda runs consistently between 80°C and 85°C (176°F to 185°F). This feels a tad cooler than what I’m used to in other cars. Interestingly, once it reaches this temperature, it holds steady regardless of driving conditions – whether I’m stuck in stop-start traffic or idling for a good 20 minutes. The temperature gauge on the dashboard barely moves until it hits around 55°C (132°F), and by the time it reaches the top of the gauge, the actual temperature is already about 75°C (165°F). It appears the thermostat doesn’t fully open until the engine is at its normal operating temperature, as that’s when I see the ECT2 (radiator coolant) temperature start to climb.
Another interesting observation with the BlueDriver OBD2 is regarding fuel trims. So far, my fuel trims have consistently been negative. The Short Term Fuel Trim (STFT) is averaging around -5.5%, and the Long Term Fuel Trim (LTFT) is about -8%. I’ve been running on E0 fuel, and I recently switched to E10 petrol to see if this makes a positive change, as some users have suggested might happen. It’ll be interesting to monitor how this changes things.
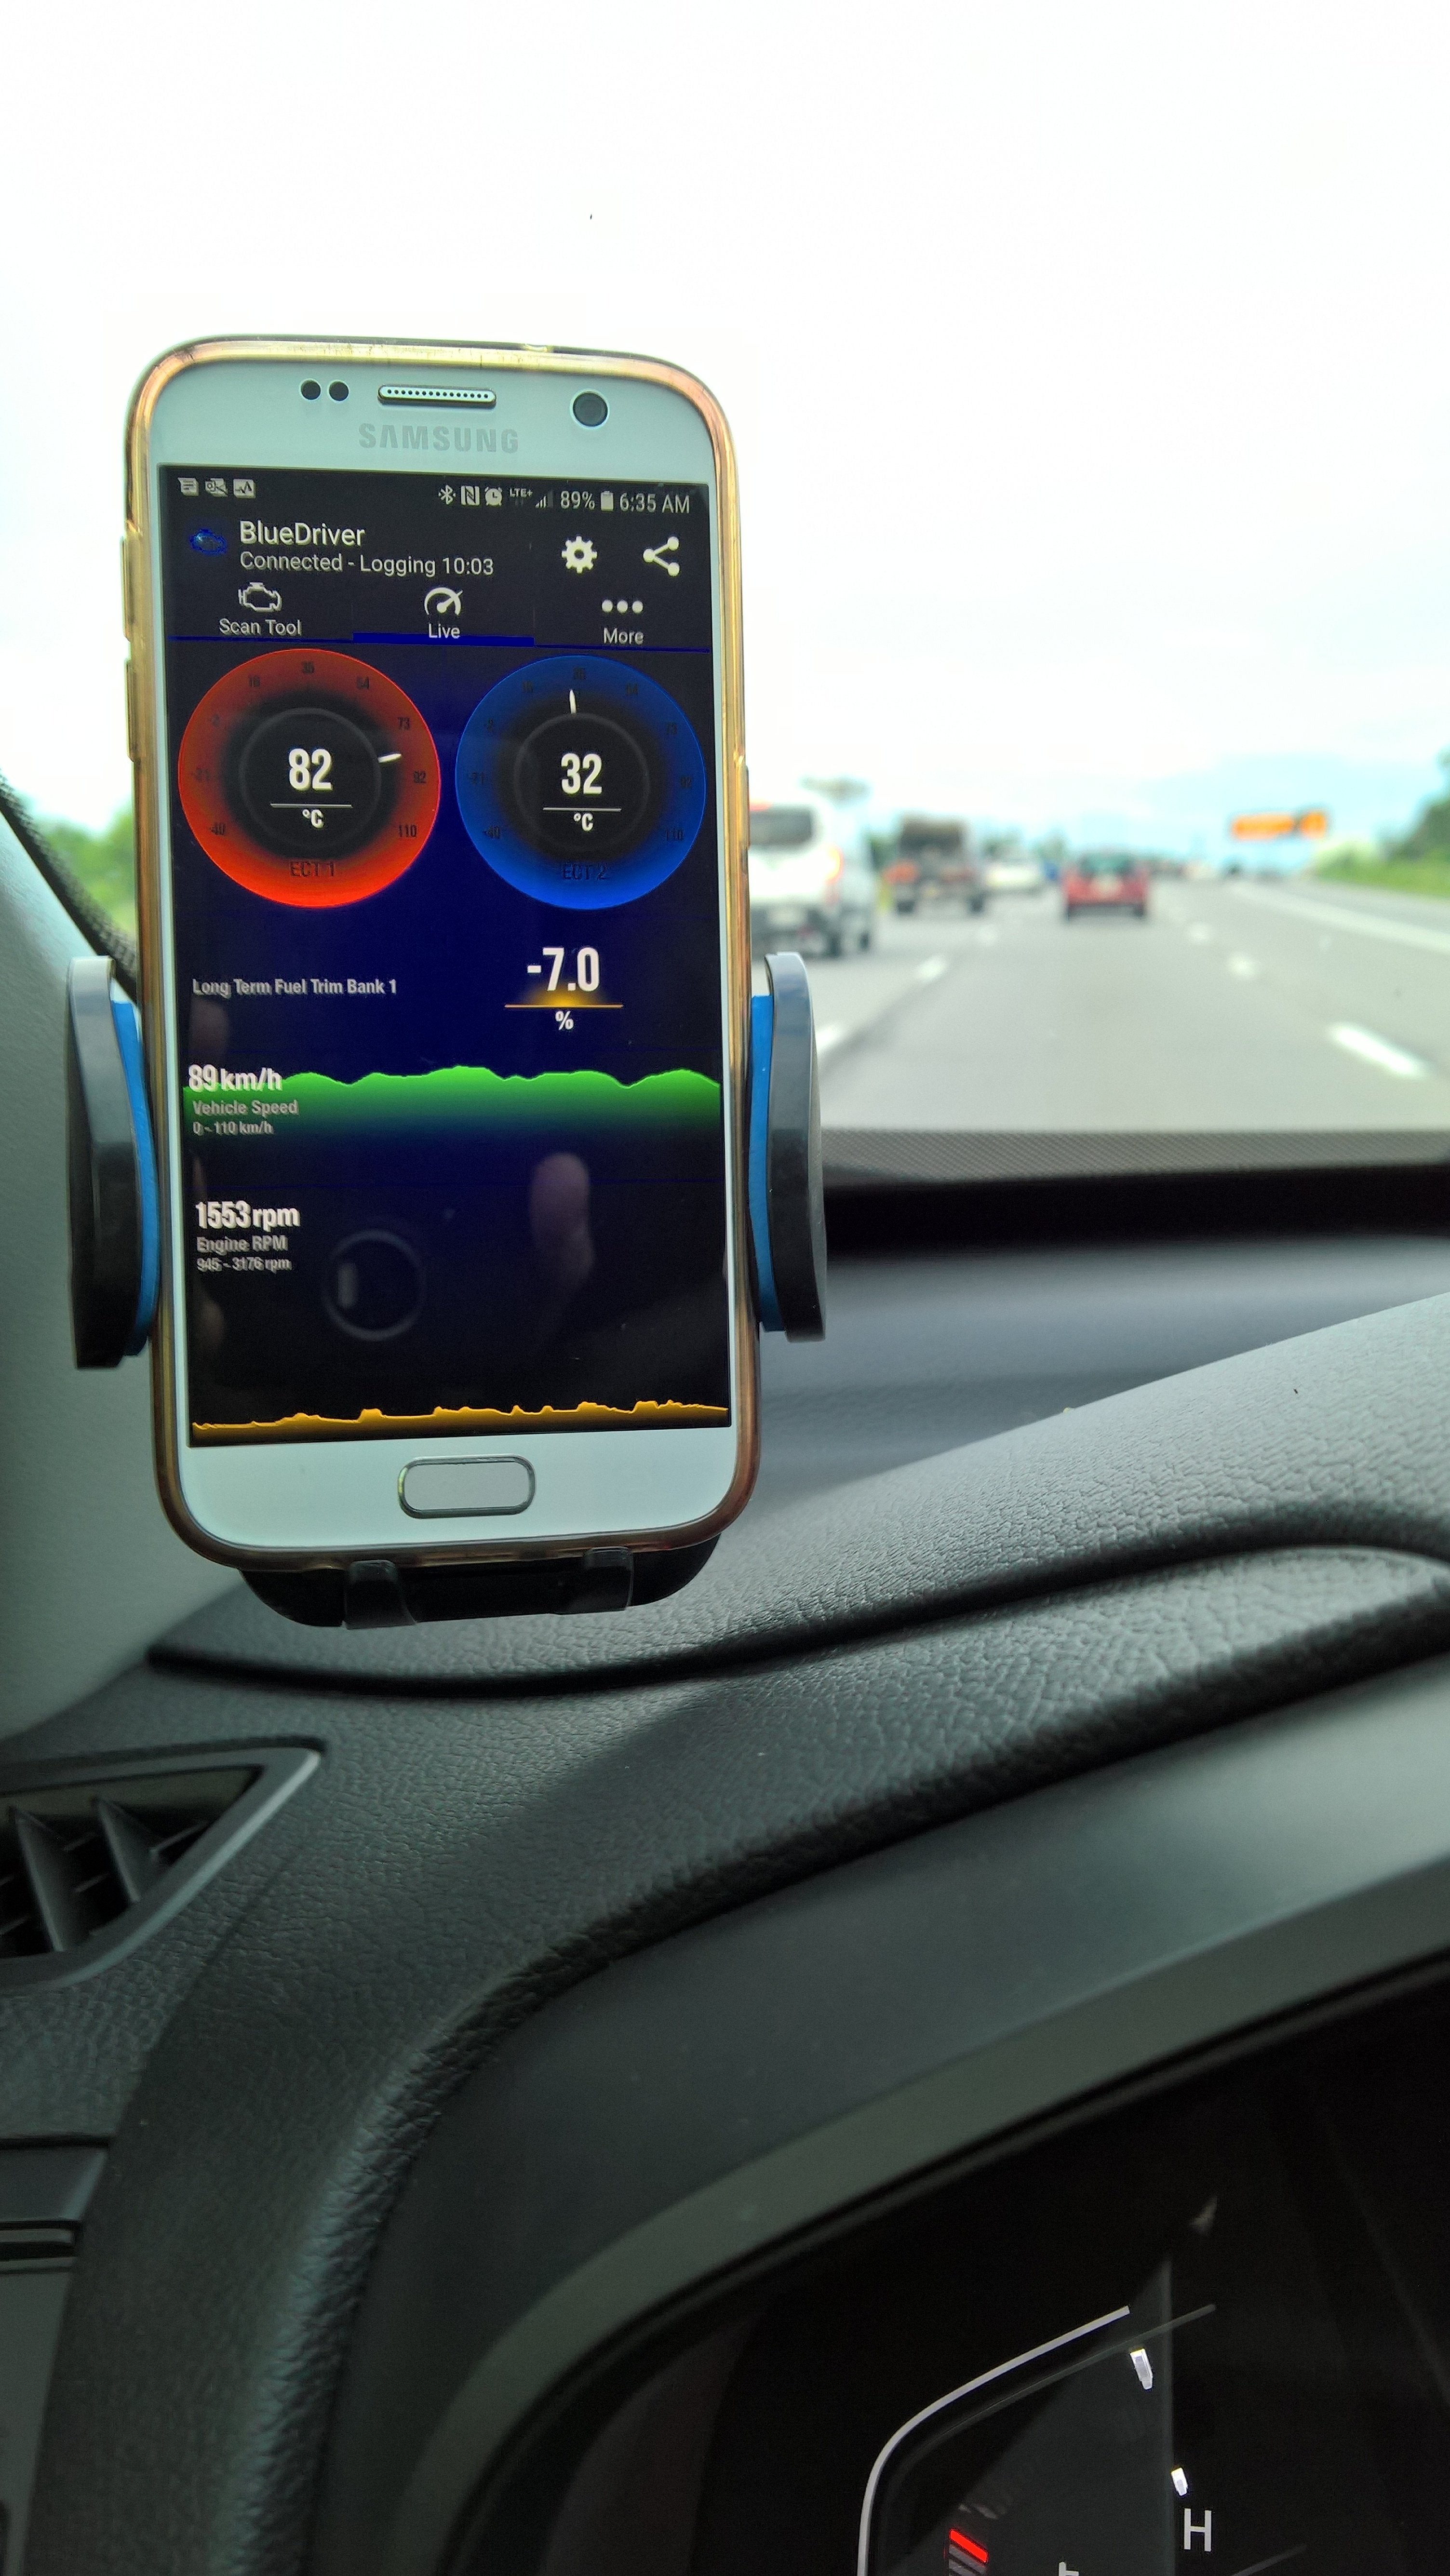
Below are some snapshots of the live data display I captured while driving using the BlueDriver app. You can also see the graphs generated from this data, which are very easy to create within the app itself. The first image shows the full spectrum of live data I’m tracking, while the second graph provides a closer look, ‘zoomed’ in view of just the STFT and LTFT values.
It will be really insightful to see how these readings fluctuate as we head into the colder months here in the UK. Not only do I live in a region that experiences quite cold winters, but my daily commute also falls into what Honda considers a ‘short distance’ drive. Looking forward to seeing how the BlueDriver OBD2 scanner helps me monitor my car’s performance through the changing seasons.